Figure 12-2 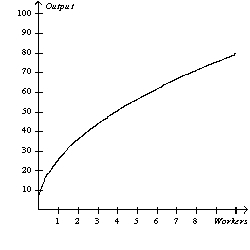
-Refer to Figure 12-2.The graph illustrates a typical
A) total-cost curve.
B) production function.
C) production possibilities frontier.
D) marginal product of labor curve.
Correct Answer:
Verified
Q159: Table 12-2 Q161: Table 12-4 Q162: Table 12-4 Q163: Table 12-6 Q165: Table 12-5 Q166: Table 12-4 Q167: Table 12-6 Q168: Table 12-4 Q169: Table 12-4 Q419: On a 100-acre farm, a farmer is Unlock this Answer For Free Now! View this answer and more for free by performing one of the following actions Scan the QR code to install the App and get 2 free unlocks Unlock quizzes for free by uploading documents
![]()
Charles's Math Tutoring
![]()
Charles's Math Tutoring
![]()
Wooden Chair Factory
![]()
![]()
Charles's Math Tutoring
![]()
Wooden Chair Factory
![]()
Charles's Math Tutoring
![]()
Charles's Math Tutoring
![]()

