Figure 12-3 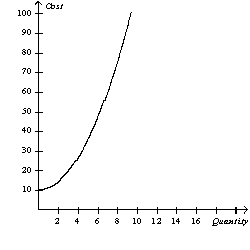
-Refer to Figure 12-3.The graph illustrates a typical
A) total-cost curve.
B) production function.
C) production possibilities frontier.
D) fixed-cost curve.
Correct Answer:
Verified
Q162: Which of the following costs do not
Q168: In the short run, a firm incurs
Q173: Fixed costs can be defined as costs
Q183: Table 12-6 Q184: Figure 12-3 Q186: Scenario 12-12 Q187: Figure 12-3 Q190: Scenario 12-12 Q193: Figure 12-3 Q452: If the total cost curve gets steeper Unlock this Answer For Free Now! View this answer and more for free by performing one of the following actions Scan the QR code to install the App and get 2 free unlocks Unlock quizzes for free by uploading documents
Wooden Chair Factory
![]()
![]()
If Farmer Brown plants no seeds![]()
If Farmer Brown plants no seeds![]()

