Figure 12-3 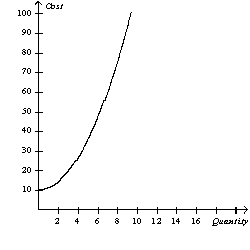
-Refer to Figure 12-3.The graph illustrates a typical total cost curve.Based on its shape,what does the corresponding production function look like?
A) an upward-sloping curve that increases at an increasing rate
B) an upward-sloping curve that increases at a decreasing rate
C) a downward-sloping curve
D) a horizontal straight line
Correct Answer:
Verified
Q161: Some costs do not vary with the
Q167: For a construction company that builds houses,
Q185: Cindy's Car Wash has average variable costs
Q186: Average total cost equals
A)change in total costs
Q196: Average total cost tells us the
A)total cost
Unlock this Answer For Free Now!
View this answer and more for free by performing one of the following actions

Scan the QR code to install the App and get 2 free unlocks

Unlock quizzes for free by uploading documents