Figure 13-9
In the figure below,panel (a) depicts the linear marginal cost of a firm in a competitive market,and panel (b) depicts the linear market supply curve for a market with a fixed number of identical firms. 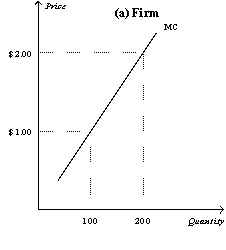
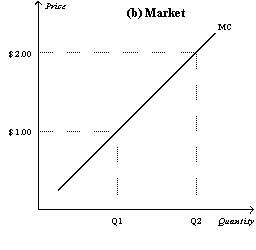
-Refer to Figure 13-9.If there are 400 identical firms in this market,what is the value of Q2?
A) 4,000
B) 8,000
C) 40,000
D) 80,000
Correct Answer:
Verified
Q94: In a market with 1,000 identical firms,
Q96: In a perfectly competitive market, the market
Q305: Figure 13-10
In the figure below,panel (a)depicts the
Q306: Figure 13-10
In the figure below,panel (a)depicts the
Q310: Figure 13-9
In the figure below,panel (a)depicts the
Q311: Figure 13-9
In the figure below,panel (a)depicts the
Q312: In the short run for a particular
Q312: Figure 13-10
In the figure below,panel (a)depicts the
Q313: Figure 13-11 Q426: Which of the following represents the firm's![]()
Unlock this Answer For Free Now!
View this answer and more for free by performing one of the following actions

Scan the QR code to install the App and get 2 free unlocks

Unlock quizzes for free by uploading documents