Figure 17-1.On the horizontal axis,K/L represents capital (K) per worker (L) .On the vertical axis,Y/L represents output (Y) per worker (L) . 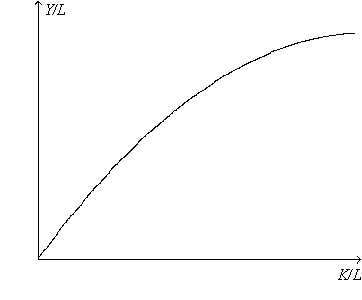
-Refer to Figure 17-1.The curve becomes flatter as the amount of capital per worker increases because of
A) increasing returns to capital.
B) increasing returns to labor.
C) diminishing returns to capital.
D) diminishing returns to labor.
Correct Answer:
Verified
Q25: If a country's saving rate declined,then other
Q29: If a country increases its saving rate,which
Q31: In the long run,a higher saving rate
A)cannot
Q36: If a country's saving rate increases,then in
Q43: Two countries are the same,except one is
Q47: The logic behind the catch-up effect is
Q60: According to studies using international data,an increase
Q232: If a country increases its saving rate
Q236: All else equal, by saving more, a
Q244: Country A has real GDP per person
Unlock this Answer For Free Now!
View this answer and more for free by performing one of the following actions

Scan the QR code to install the App and get 2 free unlocks

Unlock quizzes for free by uploading documents