Figure 18-1.The figure depicts a demand-for-loanable-funds curve and two supply-of-loanable-funds curves. 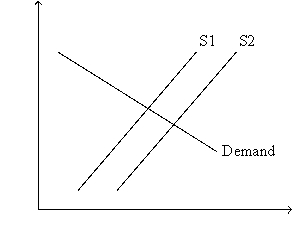
-Refer to Figure 18-1.What is measured along the vertical axis of the graph?
A) the nominal interest rate
B) the real interest rate
C) the quantity of investment
D) the quantity of saving
Correct Answer:
Verified
Q98: Which of the following is included in
Q120: For an imaginary economy,when the real interest
Q123: A government reduces its budget deficit,but at
Q375: Figure 18-4.On the horizontal axis of the
Q376: Figure 18-3.The figure shows two demand-for-loanable-funds curves
Q378: Figure 18-3.The figure shows two demand-for-loanable-funds curves
Q381: Other things the same, an increase in
Q383: Figure 18-4.On the horizontal axis of the
Q385: If the budget deficit increases then
A) saving
Q385: Figure 18-4.On the horizontal axis of the
Unlock this Answer For Free Now!
View this answer and more for free by performing one of the following actions

Scan the QR code to install the App and get 2 free unlocks

Unlock quizzes for free by uploading documents