Figure 18-2.The figure depicts a supply-of-loanable-funds curve and two demand-for-loanable-funds curves. 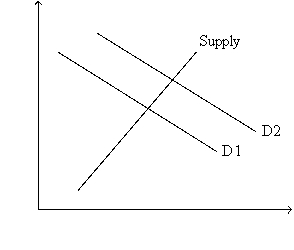
-Refer to Figure 18-2.What is measured along the horizontal axis of the graph?
A) the quantity of loanable funds
B) the size of the government budget deficit or surplus
C) the real interest rate
D) the nominal interest rate
Correct Answer:
Verified
Q93: Which of the following counts as part
Q94: If the government instituted an investment tax
Q98: Which of the following is included in
Q114: Which of the following are effects of
Q207: Suppose the government changed the tax laws,
Q368: Figure 18-3.The figure shows two demand-for-loanable-funds curves
Q369: Figure 18-1.The figure depicts a demand-for-loanable-funds curve
Q370: Figure 18-3.The figure shows two demand-for-loanable-funds curves
Q375: Figure 18-4.On the horizontal axis of the
Q376: Figure 18-3.The figure shows two demand-for-loanable-funds curves
Unlock this Answer For Free Now!
View this answer and more for free by performing one of the following actions

Scan the QR code to install the App and get 2 free unlocks

Unlock quizzes for free by uploading documents