Figure 18-3.The figure shows two demand-for-loanable-funds curves and two supply-of-loanable-funds curves. 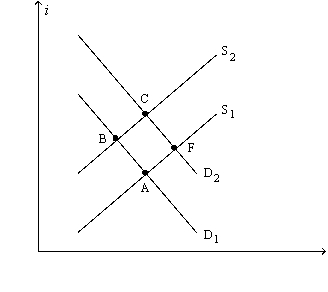
-Refer to Figure 18-3.What,specifically,does the label on the vertical axis,i,represent?
A) the nominal interest rate
B) the real interest rate
C) the inflation rate
D) the dividend yield
Correct Answer:
Verified
Q69: Suppose the government ran a budget surplus
Q86: The supply of loanable funds would shift
Q88: A government budget deficit affects the supply
Q89: Which of the following events could explain
Q91: A policy that induces people to save
Q95: According to the loanable funds model,which of
Q96: Which of the following events could explain
Q100: Which of the following is correct?
A)In a
Q362: Figure 18-2.The figure depicts a supply-of-loanable-funds curve
Q363: Figure 18-3.The figure shows two demand-for-loanable-funds curves
Unlock this Answer For Free Now!
View this answer and more for free by performing one of the following actions

Scan the QR code to install the App and get 2 free unlocks

Unlock quizzes for free by uploading documents