Figure 18-3.The figure shows two demand-for-loanable-funds curves and two supply-of-loanable-funds curves. 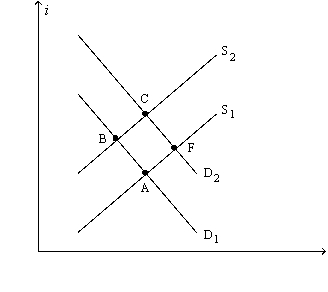
-Refer to Figure 18-3.A shift of the demand curve from D1 to D2 is called
A) an increase in the demand for loanable funds,and that increase would originate from people who had some extra income they wanted to lend.
B) an increase in the demand for loanable funds,and that increase would originate from households and firms who wish to borrow to make investments.
C) a decrease in the demand for loanable funds,and that decrease would originate from people who had some extra income they wanted to lend.
D) a decrease in the demand for loanable funds,and that decrease would originate from households and firms who wish to borrow to make investments.
Correct Answer:
Verified
Q93: Which of the following counts as part
Q94: If the government instituted an investment tax
Q95: According to the loanable funds model,which of
Q100: Which of the following is correct?
A)In a
Q114: Which of the following are effects of
Q207: Suppose the government changed the tax laws,
Q368: Figure 18-3.The figure shows two demand-for-loanable-funds curves
Q369: Figure 18-1.The figure depicts a demand-for-loanable-funds curve
Q372: Figure 18-2.The figure depicts a supply-of-loanable-funds curve
Q375: Figure 18-4.On the horizontal axis of the
Unlock this Answer For Free Now!
View this answer and more for free by performing one of the following actions

Scan the QR code to install the App and get 2 free unlocks

Unlock quizzes for free by uploading documents