Figure 18-4.On the horizontal axis of the graph,L represents the quantity of loanable funds in billions of dollars. 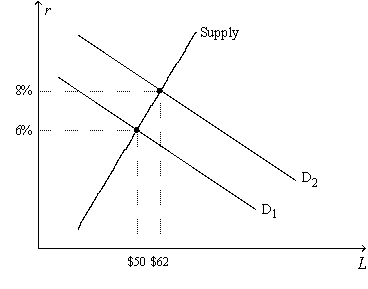
-Refer to Figure 18-4.The position and/or slope of the Supply curve are influenced by
A) the level of public saving.
B) the level of national saving.
C) decisions made by people who have extra income they want to save and lend out.
D) All of the above are correct.
Correct Answer:
Verified
Q3: Mutual funds are a type of financial
Q125: In which case would people desire to
Q131: We interpret the meaning of "loanable funds"
Q132: Suppose in some country that the first
Q135: If Congress instituted an investment tax credit
A)it
Q136: For an imaginary economy,when the real interest
Q137: Other things the same,an increase in the
Q138: The slope of the supply of loanable
Q140: As real interest rates fall,firms desire to
A)buy
Q391: Figure 18-4.On the horizontal axis of the
Unlock this Answer For Free Now!
View this answer and more for free by performing one of the following actions

Scan the QR code to install the App and get 2 free unlocks

Unlock quizzes for free by uploading documents