Figure 19-1.The figure shows a utility function. 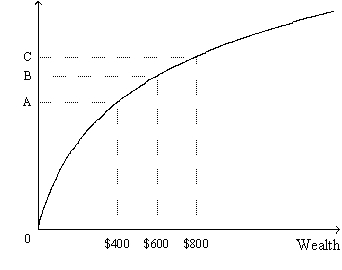
-Refer to Figure 19-1.Which distance along the vertical axis represents the marginal utility of an increase in wealth from $600 to $800?
A) the distance between the origin and point B
B) the distance between the origin and point C
C) the distance between point A and point C
D) the distance between point B and point C
Correct Answer:
Verified
Q7: Risk aversion helps to explain various things
Q16: Economists have developed models of risk aversion
Q182: Suppose you win a small lottery and
Q182: Matt's Utility Function Q183: Suppose you will receive $800 in two Q186: Figure 19-1.The figure shows a utility function. Q189: Figure 19-1.The figure shows a utility function. Q190: Figure 19-1.The figure shows a utility function. Q195: A company that produces computer peripherals is Q199: The present value of a future payment![]()
Unlock this Answer For Free Now!
View this answer and more for free by performing one of the following actions

Scan the QR code to install the App and get 2 free unlocks

Unlock quizzes for free by uploading documents