Figure 22-1 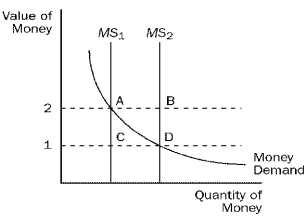
-Refer to Figure 22-1.When the money supply curve shifts from MS1 to MS2,
A) the demand for goods and services decreases.
B) the economy's ability to produce goods and services increases.
C) the equilibrium price level decreases.
D) None of the above is correct.
Correct Answer:
Verified
Q93: On a given morning,Franco sold 40 pairs
Q94: Figure 22-1 Q95: Figure 22-2.On the graph,MS represents the money Q96: Figure 22-3.On the graph,MS represents the money Q97: Figure 22-3.On the graph,MS represents the money Q98: Figure 22-3.On the graph,MS represents the money Q100: Figure 22-2.On the graph,MS represents the money Q108: Suppose each good costs $5 per unit Q116: Suppose ice cream cones costs $3.Molly holds Q152: The price level is a![]()
A)relative variable.
B)dichotomous variable
C)real
Unlock this Answer For Free Now!
View this answer and more for free by performing one of the following actions

Scan the QR code to install the App and get 2 free unlocks

Unlock quizzes for free by uploading documents