Figure 22-3.On the graph,MS represents the money supply and MD represents money demand.The usual quantities are measured along the axes. 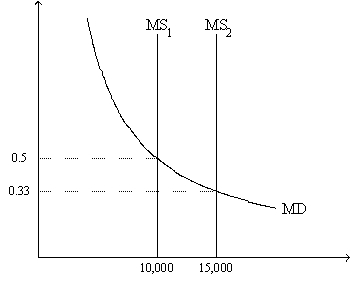
-Refer to Figure 22-3.Which of the following events could explain a shift of the money-supply curve from MS1 to MS2?
A) an increase in the value of money
B) a decrease in the price level
C) an open-market purchase of bonds by the Federal Reserve
D) None of the above is correct.
Correct Answer:
Verified
Q82: Economic variables whose values are measured in
Q85: Figure 22-1 Q86: Figure 22-3.On the graph,MS represents the money Q87: Figure 22-2.On the graph,MS represents the money Q88: Figure 22-2.On the graph,MS represents the money Q89: Figure 22-2.On the graph,MS represents the money Q91: Figure 22-2.On the graph,MS represents the money Q93: Figure 22-2.On the graph,MS represents the money Q94: Figure 22-1 Q95: Figure 22-2.On the graph,MS represents the money![]()
![]()
Unlock this Answer For Free Now!
View this answer and more for free by performing one of the following actions

Scan the QR code to install the App and get 2 free unlocks

Unlock quizzes for free by uploading documents