Multiple Choice
Exhibit 19.1 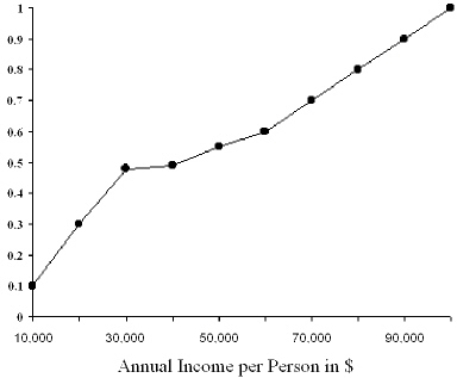 Refer to Exhibit 19.1.$50,000 represents the ____ in the figure above.
A) median.
B) sixtieth percentile.
C) third quartile.
D) seventieth percentile.
E) None of the above.
Correct Answer:
Verified
Related Questions
Q10: The one-way tabulation is NOT used to
A)locate
Q11: Exhibit 19.2 Q12: Exhibit 19.1 Q13: Which of the following is TRUE? Q13: Histograms are used to![]()
![]()
A)A frequency
A) investigate the relation

