The figure shown below represents a control chart determined from attribute data.Given this chart and the plotted observations,the most appropriate action would be 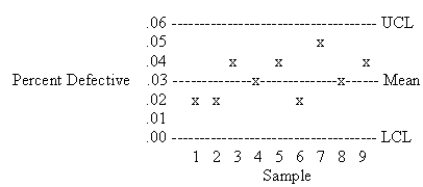
A) take immediate action to identify potential causes of the variation.
B) decrease the confidence interval for the control chart.
C) do nothing because the process appears to be operating in control.
D) increase the confidence interval for the control chart.
Correct Answer:
Verified
Q10: Which of the following techniques are used
Q11: Sampling inspection by attributes
A) means each item
Q12: The ability of the process to meet,or
Q13: A process for filling liquid laundry detergent
Q14: Which of the following statements about process
Q16: Suppose that you have taken 30 samples
Q17: Which of the following is/are assumption(s)of process
Q18: Which of the following statements about process
Q19: Regarding the design of a quality control
Q20: Suppose that a process is in a
Unlock this Answer For Free Now!
View this answer and more for free by performing one of the following actions

Scan the QR code to install the App and get 2 free unlocks

Unlock quizzes for free by uploading documents