Figure 1-7 shows the production possibilities boundary for an economy that produces two goods - cotton and bananas. 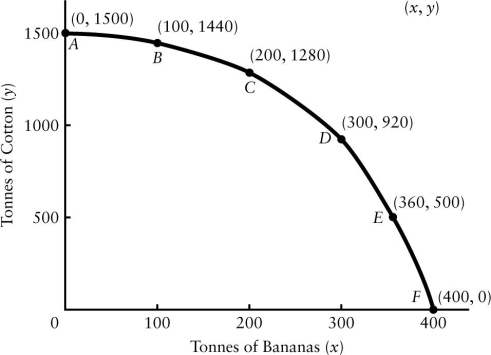 FIGURE 1-7
-Refer to Figure 1-7.A production possibilities boundary is shown for an economy that produces two goods - cotton and bananas,both measured in tonnes produced per year.Suppose the economy is currently producing at point A.What is the opportunity cost to this economy of increasing production of bananas by 100 tonnes?
A) there is no opportunity cost
B) 60 tonnes of cotton
C) 100 tonnes of cotton
D) 1440 tonnes of bananas
E) 1500 tonnes of bananas
Correct Answer:
Verified
Q87: Figure 1-7 shows the production possibilities boundary
Q88: Which of the following statements best describes
Q89: Suppose drought destroys many millions of acres
Q92: Figure 1-7 shows the production possibilities boundary
Q93: The downward-sloping line in the diagram below
Q97: An insight first fully developed by Adam
Q101: If an economy exhibits the specialization of
Q114: Which of the following statements about specialization
Q116: A farmer selling tomatoes and corn at
Q120: Specialization of labour led to greater efficiency
Unlock this Answer For Free Now!
View this answer and more for free by performing one of the following actions

Scan the QR code to install the App and get 2 free unlocks

Unlock quizzes for free by uploading documents