Figure 1-7 shows the production possibilities boundary for an economy that produces two goods - cotton and bananas. 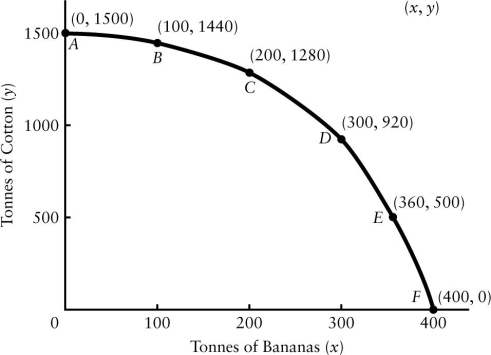 FIGURE 1-7
-Refer to Figure 1-7.A production possibilities boundary is shown for an economy that produces two goods - cotton and bananas,both measured in tonnes produced per year.If the economy moves from point C to point D,what is the opportunity cost of each extra tonne of bananas produced?
A) 0.036 tonnes of cotton
B) 0.36 tonnes of cotton
C) 3.6 tonnes of cotton
D) 36 tonnes of cotton
E) 360 tonnes of cotton
Correct Answer:
Verified
Q63: Suppose there are only two goods produced
Q89: Suppose drought destroys many millions of acres
Q92: Figure 1-7 shows the production possibilities boundary
Q92: A modern economy like Canada's is largely
Q93: The downward-sloping line in the diagram below
Q99: A greater specialization of labour leads to
Q100: Figure 1-7 shows the production possibilities boundary
Q101: If an economy exhibits the specialization of
Q105: The famous economist who first described the
Q109: Which of the following results from the
Unlock this Answer For Free Now!
View this answer and more for free by performing one of the following actions

Scan the QR code to install the App and get 2 free unlocks

Unlock quizzes for free by uploading documents