The table below shows hypothetical per-minute cell phone charges for "pay-and-talk" service over several years.
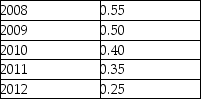 TABLE 2-2
-Refer to Table 2-2.Assume that 2008 is used as the base year,with the index number = 100.What is the percentage change in the per-minute charge from 2011 to 2012?
A) -28.6%
B) -10.0%
C) -71.4%
D) -25.0%
E) -35.0%
Correct Answer:
Verified
Q39: Suppose a theory predicts that lowering tuition
Q43: The table below shows hypothetical tuition costs
Q44: The base year for an index number
Q45: The table below shows hypothetical per-minute cell
Q47: The table below shows hypothetical per-minute cell
Q50: An index number expresses the value of
Q50: The table below shows hypothetical data for
Q51: As a science,economics is disadvantaged in that
A)it
Q51: When studying economic data,index numbers are especially
Q55: If a theory's prediction is tested and
Unlock this Answer For Free Now!
View this answer and more for free by performing one of the following actions

Scan the QR code to install the App and get 2 free unlocks

Unlock quizzes for free by uploading documents