The table below shows the approximate value of Canada's crude oil and natural gas exports over a 5-year period.The amounts shown are billions of dollars.
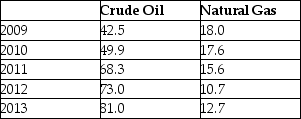 TABLE 2-7
-Refer to Table 2-7.Assume that 2009 is the base year,with an index number = 100.What is the percentage change in the value of exports of crude oil from 2009 to 2013?
A) 90.6%
B) 190.6%
C) 100%
D) 96%
E) 0.906%
Correct Answer:
Verified
Q87: Data collected repeatedly over successive periods of
Q96: What is the best way to display
Q97: According to the Bank of Canada's website,Canada's
Q99: A scatter diagram
A)is a graph of a
Q100: The statement "Y is a function of
Unlock this Answer For Free Now!
View this answer and more for free by performing one of the following actions

Scan the QR code to install the App and get 2 free unlocks

Unlock quizzes for free by uploading documents