Multiple Choice
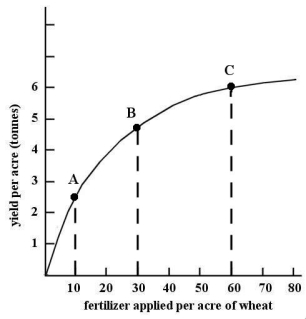 FIGURE 2-4
-Refer to Figure 2-4.The slope of the non-linear function changes as we move along the curve.The slope is
A) positive and increasing,indicating an increasing marginal response.
B) negative and decreasing,indicating a diminishing marginal response.
C) positive and decreasing,indicating a diminishing marginal response.
D) negative and increasing,indicating an increasing marginal response.
E) constant at all points,indicating a constant marginal response.
Correct Answer:
Verified
Related Questions
Q113: On a coordinate graph with y on
Q117: On a coordinate graph with y on
Q121: Figure 2-5 shows monthly average (per unit)production

