 FIGURE 5-1
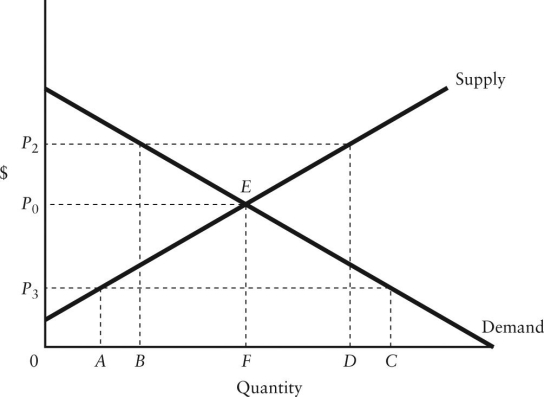
-Refer to Figure 5-1.If the diagram applies to the labour market,and P3 represents a legislated minimum wage,
A) there will be excess demand of AC in the labour market.
B) there will be unemployment of AC in the labour market.
C) the free-market equilibrium wage is P0 and the labour market is unaffected by the minimum wage.
D) the labour market is in disequilibrium.
E) the amount of labour employed will rise from quantity F to quantity C.
Correct Answer:
Verified
Q37: Suppose that the free-market equilibrium price of
Q38: An excess demand for some product is
Q39: Which of the following is true of
Q40: Suppose the government decides to eliminate a
Q41: Q43: Q44: The shortages associated with a binding price Q45: The surpluses associated with a binding price Q46: If the equilibrium price for some product Q47: Unlock this Answer For Free Now! View this answer and more for free by performing one of the following actions Scan the QR code to install the App and get 2 free unlocks Unlock quizzes for free by uploading documents![]()
![]()
![]()

