The diagram below shows the market for litres of milk. 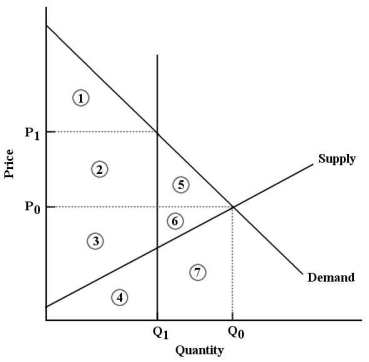 FIGURE 5-8
-Refer to Figure 5-8.After the imposition of a milk quota at quantity Q1,economic surplus is represented by
A) areas 1,2 and 5.
B) areas 3 and 4.
C) areas 1,2 and 3.
D) areas 1,2,3,4,5,6 and 7.
E) areas 2,3,5 and 6.
Correct Answer:
Verified
Q109: Q110: Q111: Consider the Canadian market for barley.Suppose a Q112: Consider Canada's east coast lobster fishery.Suppose the Q113: Which of the following statements most accurately Q115: One measure of the extent of market Q116: Consider the following demand and supply schedules Q117: In general (and in the absence of Q118: Q119: Unlock this Answer For Free Now! View this answer and more for free by performing one of the following actions Scan the QR code to install the App and get 2 free unlocks Unlock quizzes for free by uploading documents![]()
![]()
![]()
![]()

