Diagrams A,B,and C show 3 individual consumers' demand curves for cement.Consumers A,B,and C constitute the entire monthly cement market in this region. 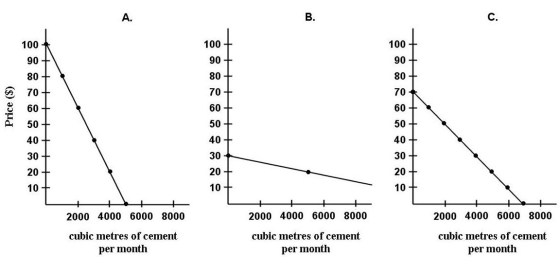 FIGURE 6-3
-Refer to Figure 6-3.What is the market demand (in cubic metres per month) for cement at a price of $80 per cubic metre?
A) 0
B) 1000
C) 2000
D) 3000
E) 4000
Correct Answer:
Verified
Q47: The substitution effect of a price change
A)will
Q48: Consider the income and substitution effects of
Q49: Suppose there are only two goods,A and
Q50: Consider the income and substitution effects of
Q51: The market demand curve is derived from
A)the
Q53: A demand curve for a normal good
Q54: Marginal utility analysis predicts a downward-sloping demand
Q55: Bjorn is a student with a monthly
Q56: Suppose a consumer can purchase only two
Q57: Laurie spends all of her money buying
Unlock this Answer For Free Now!
View this answer and more for free by performing one of the following actions

Scan the QR code to install the App and get 2 free unlocks

Unlock quizzes for free by uploading documents