The diagram below shows a set of budget lines facing a household. 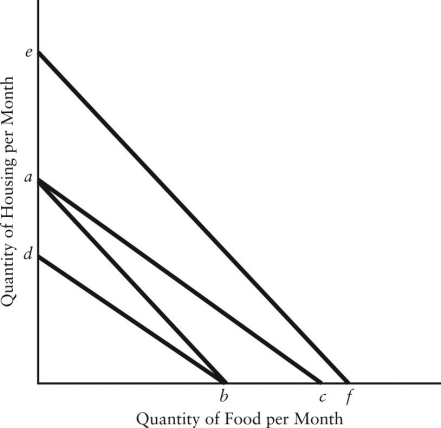 FIGURE 6-8
-Refer to Figure 6-8.The movement of the budget line from ab to ef could be caused by
A) a decrease in real income.
B) an increase in money income.
C) an equal percentage increase in the price of both food and housing.
D) a decrease in the price of either food or housing.
E) an increase in the price of either food or housing.
Correct Answer:
Verified
Q105: The marginal rate of substitution measures the
Q106: The paradox in "the paradox of value"
Q107: The diagram below shows a set of
Q108: The diagram below shows a set of
Q109: An indifference curve plotted for two different
Q111: Since there is a limited supply of
Q112: If money income is reduced by half,and
Q113: A parallel shift in the consumer's budget
Q114: The diagram below shows a set of
Q115: The marginal rate of substitution
A)always has a
Unlock this Answer For Free Now!
View this answer and more for free by performing one of the following actions

Scan the QR code to install the App and get 2 free unlocks

Unlock quizzes for free by uploading documents