The figures below show Chris's consumption of specialty coffee per week. 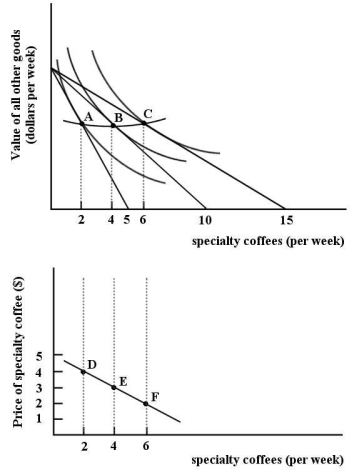 FIGURE 6-10
-Refer to Figure 6-10.The two diagrams in Figure 6-10 are showing
A) the change in Chris's preferences toward specialty coffee.
B) that Chris is indifferent between bundles A,B and C.
C) the derivation of Chris's demand curve for specialty coffee.
D) that Chris is indifferent between points D,E and F.
E) the derivation of Chris's indifference curve for specialty coffee.
Correct Answer:
Verified
Q128: 6A-5 Income and Substitution Effects 
Q129: Q130: Assume the quantity of good X is Q131: Suppose a consumer can purchase only two Q132: The figures below show Chris's consumption of Q134: 6A-4 Deriving the Demand Curve![]()
-Refer to Figure
Unlock this Answer For Free Now!
View this answer and more for free by performing one of the following actions

Scan the QR code to install the App and get 2 free unlocks

Unlock quizzes for free by uploading documents