The diagram below shows some short-run cost curves for a firm. 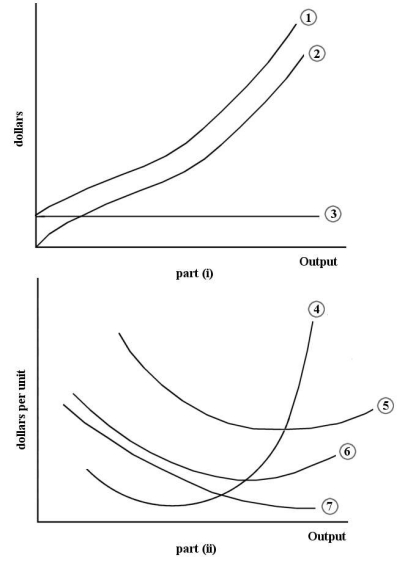 FIGURE 7-2
-Refer to Figure 7-2.Which of the following choices correctly identifies the cost curves in part (i) of the figure?
A) Curve 1 is the total cost curve. Curve 2 is the total variable cost curve.
Curve 3 is the total fixed cost curve.
B) Curve 1 is the total fixed cost curve. Curve 2 is the total variable cost curve.
Curve 3 is the total cost curve.
C) Curve 1 is the total variable cost curve. Curve 2 is the total cost curve.
Curve 3 is the total fixed cost curve.
D) Curve 1 is the total marginal cost curve. Curve 2 is the total average cost curve.
Curve 3 is the total average fixed cost curve.
E) Curve 1 is the total cost curve. Curve 2 is the total variable cost curve.
Curve 3 is the average fixed cost curve.
Correct Answer:
Verified
Q123: The following data show the total output
Q124: The following data show the total output
Q125: The following data show the total output
Q126: The table below provides information on output
Q127: The following data show the total output
Q129: The table below provides information on output
Q130: The following data show the total output
Q131: The table below provides information on output
Q132: The table below provides information on output
Q133: The following data show the total output
Unlock this Answer For Free Now!
View this answer and more for free by performing one of the following actions

Scan the QR code to install the App and get 2 free unlocks

Unlock quizzes for free by uploading documents