Multiple Choice
The figure below shows a family of cost curves for a firm.The subscripts 1,2,and 3 for the SRATC curves refer to different plant sizes. 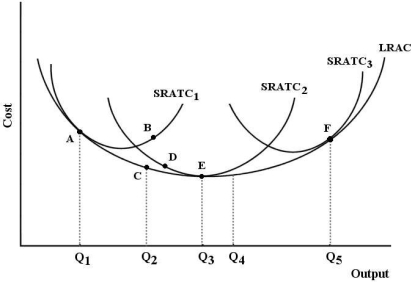 FIGURE 8-3
-Refer to Figure 8-3.The minimum efficient scale is achieved by this firm at output level
A) Q1.
B) Q2.
C) Q3.
D) Q4.
E) Q5.
Correct Answer:
Verified
Related Questions
Q95: Which of the following factors is most
Q96: A change in the technique for producing
Q97: With respect to innovation,which of the following
Q98: Consider the short-run and long-run cost curves
Q99: The figure below shows a family of
Unlock this Answer For Free Now!
View this answer and more for free by performing one of the following actions

Scan the QR code to install the App and get 2 free unlocks

Unlock quizzes for free by uploading documents