Multiple Choice
The figure below shows the isocost lines and the isoquant map for a firm producing golf tees. 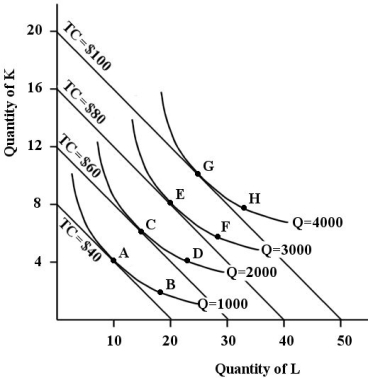 FIGURE 8-6
-Refer to Figure 8-6.This firm will minimize its costs of producing 2000 golf tees at point
A) A.
B) B.
C) C.
D) D.
E) E.
Correct Answer:
Verified
Related Questions
Q125: The figure below shows the isocost lines
Q126: Q127: Refer to Figure 8-6.The cost-minimizing factor combination![]()

