The diagram below shows the demand curve facing a single-price monopolist. 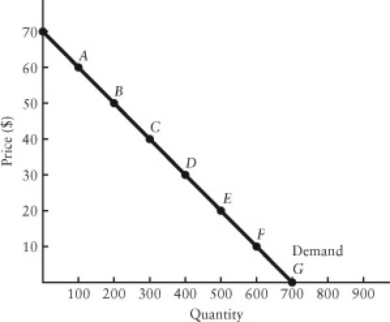 FIGURE 10-4
-Refer to Figure 10-4.What is the firm's marginal revenue per unit as it moves from point C to point D on the demand curve?
A) $0
B) $10
C) $50
D) $100
E) $3000
Correct Answer:
Verified
Q33: A monopolist will be earning positive economic
Q34: If a single-price monopoly is presently producing
Q35: The diagram below shows total revenue for
Q36: The diagram below shows the demand curve
Q37: Consider the following AR and MR curves
Q39: Consider the following AR and MR curves
Q40: The diagram below shows the demand curve
Q41: A single-price monopolist is currently producing an
Q42: Suppose a monopolist faces the demand curve
Q43: Suppose a monopolist faces the demand curve
Unlock this Answer For Free Now!
View this answer and more for free by performing one of the following actions

Scan the QR code to install the App and get 2 free unlocks

Unlock quizzes for free by uploading documents