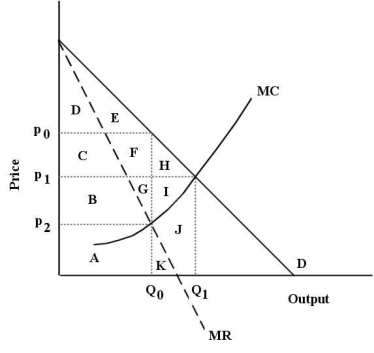
The diagram below shows the demand curve and marginal cost and marginal revenue curves for a new heart medication for which the pharmaceutical firm holds a 20-year patent on its production and sales.This protection gives the firm monopoly power for the 20 years of the patent.  FIGURE 10-6
-Refer to Figure 10-6.Assume this pharmaceutical firm charges a single price for its drug.At its profit-maximizing level of output it will produce
A) Q0 units and charge the perfectly competitive price.
B) Q0 units and charge a price of p0.
C) Q1 units and charge a price of p1.
D) Q0 units and charge a price of p2.
E) Q1 units and charge a price greater than its average total variable cost.
Correct Answer:
Verified
Q108: Consider a monopolist that is able to
Q109: The diagram below shows the demand curve
Q110: The diagram below shows the demand curve
Q111: If a monopolist is practising perfect price
Q112: The diagram below shows the demand curve
Q114: One reason airlines charge a higher price
Q115: One reason movie theatres charge a lower
Q116: The diagram below shows the demand curve
Q117: The diagram below shows the demand curve
Q118: Which one of the following cases is
Unlock this Answer For Free Now!
View this answer and more for free by performing one of the following actions

Scan the QR code to install the App and get 2 free unlocks

Unlock quizzes for free by uploading documents