The diagram below shows selected cost and revenue curves for a firm in a monopolistically competitive industry. 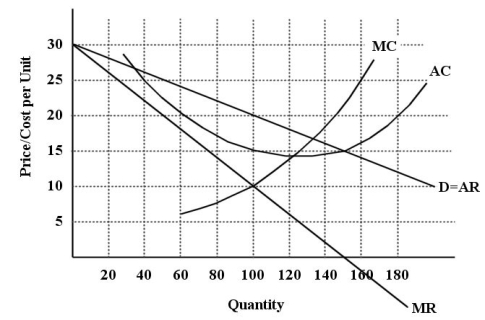 FIGURE 11-1
-Refer to Figure 11-1.Assuming this firm is producing its profit-maximizing level of output,what is the per-unit profit being earned by this firm?
A) -$5
B) -$10
C) $20
D) $10
E) $5
Correct Answer:
Verified
Q41: Which of the following are products that
Q42: The diagram below shows selected cost and
Q43: When a monopolistically competitive industry is in
Q44: A monopolistically competitive firm has some degree
Q45: The diagram below shows selected cost and
Q47: Q48: In long-run equilibrium,a monopolistically competitive industry is Q49: The diagram below shows selected cost and Q50: One prediction about monopolistic competition is that Q51: ![]()
![]()
Unlock this Answer For Free Now!
View this answer and more for free by performing one of the following actions

Scan the QR code to install the App and get 2 free unlocks

Unlock quizzes for free by uploading documents