The three diagrams below each show a supply curve for oil tankers over a relatively short period of time. 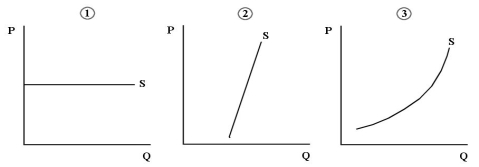 FIGURE 13-3
-Refer to Figure 13-3.Consider the supply of oil tankers to an individual Canadian shipping firm,the North American shipping industry,and the world shipping industry.Which diagram best shows the supply of oil tankers that is relevant to the North American shipping industry?
A) diagram 1
B) diagram 2
C) diagram 3
D) diagrams 2 or 3
E) diagrams 1 or 2
Correct Answer:
Verified
Q71: The elasticity of supply of computer-game programmers
Q72: Consider a firm's demand for a factor
Q73: The aggregate quantity of labour supplied will
Q74: The demand and supply curves shown below
Q75: Consider the following production and cost schedule
Q77: Consider computer programmers as a factor of
Q78: Consider a firm's demand for a factor
Q79: If small changes in incentives can induce
Q80: Assume that the market for farmland in
Q81: Suppose the government decides,in the interest of
Unlock this Answer For Free Now!
View this answer and more for free by performing one of the following actions

Scan the QR code to install the App and get 2 free unlocks

Unlock quizzes for free by uploading documents