Multiple Choice
The three diagrams below show the supply and demand for teenage babysitters in one local area.The initial supply curve is S0 in all cases. 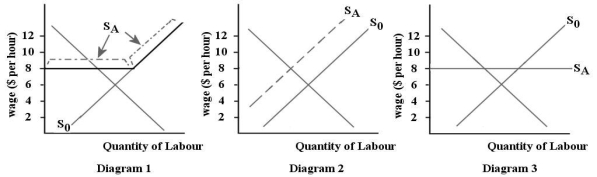 FIGURE 14-3
-Refer to Figure 14-3.Suppose all of the teenage babysitters in one local area form an association and set a minimum age of 16 for working as a babysitter.Which diagram illustrates the new supply curve (SA) for babysitters?
A) diagram 1
B) diagram 2
C) diagram 3
D) none of the diagrams
E) any of the diagrams
Correct Answer:
Verified
Related Questions
Q46: Consider a small,remote town with only one
Q47: If we compare the wage rate and
Q48: Suppose that the professional association of dentists

