The three diagrams below show the supply and demand for teenage babysitters in one local area.The initial supply curve is S0 in all cases. 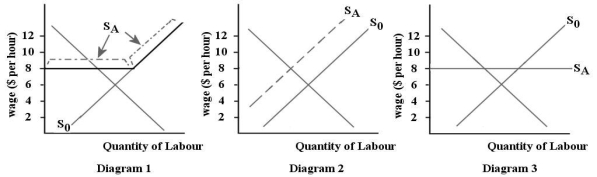 FIGURE 14-3
-Refer to Figure 14-3.Suppose all of the teenage babysitters in one local area form an association and set a minimum acceptable wage of $8 per hour.Which diagram illustrates the new supply curve (SA) for babysitters?
A) diagram 1
B) diagram 2
C) diagram 3
D) none of the diagrams
E) any of the diagrams
Correct Answer:
Verified
Q54: Q55: Suppose we have a labour market with Q56: For a monopsonist that faces an upward-sloping Q57: Suppose that a regional health authority is Q58: Consider a wage-setting union in an otherwise Q60: Consider a monopsonistic labour market.Ten units of Q61: Suppose there is a competitive market for Q62: A legislated minimum wage is comparable to![]()
A)bilateral
Unlock this Answer For Free Now!
View this answer and more for free by performing one of the following actions

Scan the QR code to install the App and get 2 free unlocks

Unlock quizzes for free by uploading documents