The three diagrams below show the supply and demand for teenage babysitters in one local area.The initial supply curve is S0 in all cases. 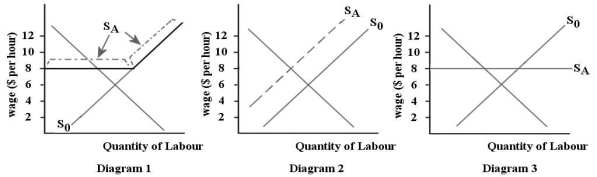 FIGURE 14-3
-Refer to Figure 14-3.Suppose the teenage babysitters in one local area are earning an equilibrium wage of $6 per hour.Now suppose that the local government imposes a minimum wage of $8 per hour for babysitters.Which diagram illustrates the new supply curve (SA) for babysitters?
A) diagram 1
B) diagram 2
C) diagram 3
D) none of the diagrams
E) any of the diagrams
Correct Answer:
Verified
Q81: Q82: The purpose of a labour union is Q83: Economists observe clear evidence of a union Q84: In general,in collective bargaining between a labour Q85: Q87: Unions currently represent _ government employees in Q88: Canadian studies on the effects of minimum-wage Unlock this Answer For Free Now! View this answer and more for free by performing one of the following actions Scan the QR code to install the App and get 2 free unlocks Unlock quizzes for free by uploading documents![]()
![]()

