The diagram below shows demand and supply curves for some perfectly competitive market. 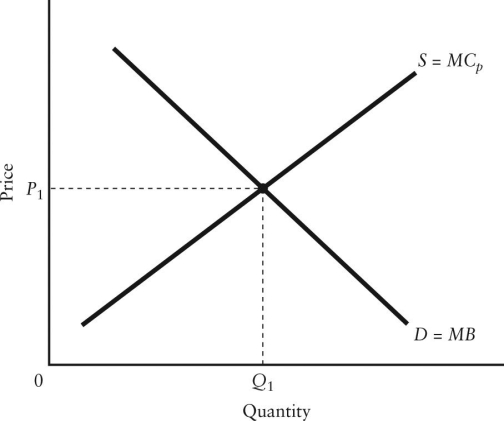 FIGURE 16-2
-Refer to Figure 16-2.Suppose that the marginal benefit curve (MB) includes all social benefits and that there is a positive externality in production.In this case,________ for allocative efficiency.
A) P1 and Q1 are appropriate
B) the price P1 is appropriate but the quantity Q1 is too low
C) the price P1 is appropriate but the quantity Q1 is too high
D) the price P1 is too low and the quantity Q1 is too high
E) the price P1 is too high and the quantity Q1 is too low
Correct Answer:
Verified
Q49: Consider a non-rivalrous good,like national defence,provided by
Q50: If a homeowner uses wood to heat
Q51: A flu vaccine has an associated _
Q52: The price charged for access to an
Q53: Consider a product (say,tulip bulbs)that generates positive
Q55: Which of the following best describes the
Q56: Consider an ordinary rivalrous good,provided in a
Q57: Which of the following best explains why
Q58: The diagram below shows the supply and
Q59: An example of a common-property resource is
A)a
Unlock this Answer For Free Now!
View this answer and more for free by performing one of the following actions

Scan the QR code to install the App and get 2 free unlocks

Unlock quizzes for free by uploading documents