The diagram below shows the marginal benefit and marginal cost of a public good.This economy has 3 individuals,A,B and C.The diagram shows the MB for each individual and a summation of their marginal benefits. 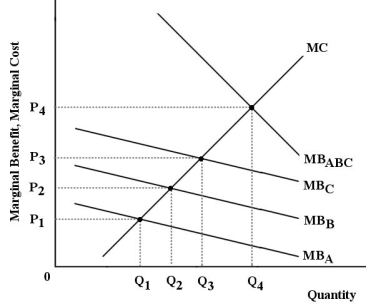 FIGURE 16-4
-Refer to Figure 16-4.What is the optimal quantity of this public good to provide?
A) Q
B) Q1
C) Q2
D) Q3
E) Q4
Correct Answer:
Verified
Q93: Moral hazard is said to exist when
Q94: Adverse selection is said to exist when
Q95: The diagram below shows the marginal benefit
Q96: It is inefficient for the government to
Q97: Suppose an advertising firm purchases additional insurance
Q99: Because of the free-rider problem,
A)the private market
Q100: Moral hazard often arises in the case
Q101: All Canadian provincial governments have legislated minimum
Q102: The Canadian government operates a progressive personal
Q103: Export Development Canada (EDC)provides insurance to Canadian
Unlock this Answer For Free Now!
View this answer and more for free by performing one of the following actions

Scan the QR code to install the App and get 2 free unlocks

Unlock quizzes for free by uploading documents