The diagram below shows the marginal benefit and marginal cost of a public good.This economy has 3 individuals,A,B and C.The diagram shows the MB for each individual and a summation of their marginal benefits. 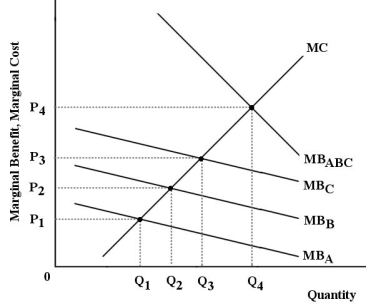 FIGURE 16-4
-Refer to Figure 16-4.The curve MBABC is derived by
A) a vertical summation of the marginal benefits of all individuals at each level of output.
B) observation of the consumption of public goods at a price of zero.
C) observation of the consumption of public goods at the optimal price.
D) a horizontal summation of the marginal benefits of all individuals at each given price level.
E) determining the private marginal cost of the public good.
Correct Answer:
Verified
Q78: Why are goods that are non-rivalrous and
Q79: Which of the following are characteristics of
Q80: A public good is a product that
Q81: Which of the following is the best
Q82: The concept of moral hazard was publicly
Q84: The diagram below shows the marginal benefit
Q85: The diagram below shows the marginal benefit
Q86: The efficient price to charge consumers for
Q87: Consider a childhood vaccination program that is
Q88: An example of adverse selection is
A)asking a
Unlock this Answer For Free Now!
View this answer and more for free by performing one of the following actions

Scan the QR code to install the App and get 2 free unlocks

Unlock quizzes for free by uploading documents