The diagram below shows the marginal costs of pollution abatement for two firms,Firm 1 and Firm 2. 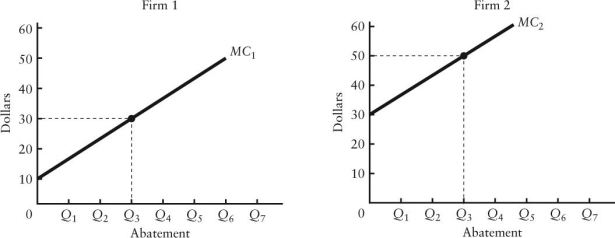 FIGURE 17-5
-Refer to Figure 17-5.If the government requires each firm to abate Q3 units of pollution,the social costs of this abatement
A) would be minimized.
B) could be reduced further if each firm was required to abate more.
C) could be reduced further if Firm 1 increased its abatement and Firm 2 reduced its abatement by the same amount.
D) could be reduced further if Firm 2 increased abatement and Firm 1 reduced its abatement by the same amount.
E) could be reduced further if each firm was allowed to pollute more.
Correct Answer:
Verified
Q58: The figure below shows the demand and
Q59: The diagram below shows the private and
Q60: Suppose a farm that is polluting an
Q61: All of the following are examples of
Q62: The diagram below shows the marginal cost
Q64: Direct pollution controls can be inefficient because,for
Q65: The banning of wood-burning stoves and fireplaces
Q66: The table below shows the marginal costs
Q67: The table below shows the marginal costs
Q68: Federal regulation aimed at reducing greenhouse-gas emissions
Unlock this Answer For Free Now!
View this answer and more for free by performing one of the following actions

Scan the QR code to install the App and get 2 free unlocks

Unlock quizzes for free by uploading documents