The diagram below shows the marginal cost of pollution abatement for two firms,Firm X and Firm Y. 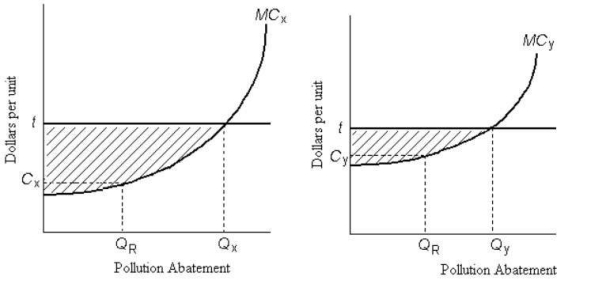 FIGURE 17-6
-Refer to Figure 17-6.Firms X and Y have an emissions tax of $t imposed on each unit of pollution they produce.Firm X will choose to abate pollution of ________ units and Firm Y will choose to abate pollution of ________ units.
A) QR; QR
B) QX; QR
C) QX; QY
D) 0; 0
E) QR; QY
Correct Answer:
Verified
Q92: Suppose a per-unit tax is imposed on
Q93: A pollution-control policy that,in principle,can perfectly internalize
Q94: Private and competitive markets could produce efficient
Q95: The diagram below shows the marginal cost
Q96: The use of emissions taxes as a
Q98: A potential disadvantage of emissions taxes versus
Q99: If residential garbage collection were financed by
Q100: Direct pollution controls are usually inefficient because
Q101: Consider a coal-fired electric-power plant that is
Q102: The diagram below shows the marginal cost
Unlock this Answer For Free Now!
View this answer and more for free by performing one of the following actions

Scan the QR code to install the App and get 2 free unlocks

Unlock quizzes for free by uploading documents