The diagram below shows the marginal cost of abatement for each of two firms,A and B.Each firm is initially abating Q0 units of pollution. 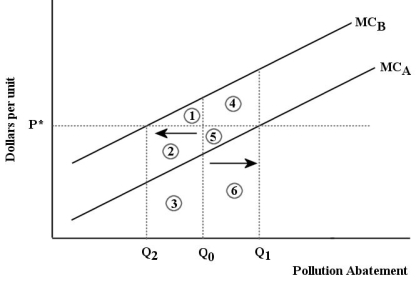 FIGURE 17-7
-Refer to Figure 17-7.Suppose that a system of tradable pollution permits is introduced into this market and the equilibrium permit price is p*.The effect will be that
A) Firm B will sell permits to Firm A,pollute less,and reduce its costs by the area 1; Firm A will buy permits from Firm B,pollute more,and increase its costs by the area 4.
B) Firm B will sell permits to Firm A,pollute more,and reduce its costs by the area 1; Firm A will buy permits from Firm B,pollute less,and increase its earnings by area 4.
C) Firm B will buy permits from Firm A,pollute less,and increase its costs by the areas 2 + 3; Firm A will sell permits to Firm B,pollute more,and reduce its earnings by areas 4 + 5.
D) Firm B will buy permits from Firm A,pollute more,and reduce its costs by the area 1; Firm A will sell permits to Firm B,pollute less,and increase its earnings by area 5.
Correct Answer:
Verified
Q113: The diagram below shows a market for
Q114: Suppose a firm producing roof shingles imposes
Q115: One possible strategy for efficiently addressing the
Q116: In a competitive market for tradable pollution
Q117: Suppose a competitive market for tradable pollution
Q119: Consider a coal-fired electric-power plant that is
Q120: The diagram below shows a market for
Q121: When comparing a system of emission taxes
Q122: Consider the following equation: GHG =
Q123: When designing a policy to reduce polluting
Unlock this Answer For Free Now!
View this answer and more for free by performing one of the following actions

Scan the QR code to install the App and get 2 free unlocks

Unlock quizzes for free by uploading documents