The diagram below shows the marginal cost of abatement for each of two firms,A and B.Each firm is initially abating Q0 units of pollution. 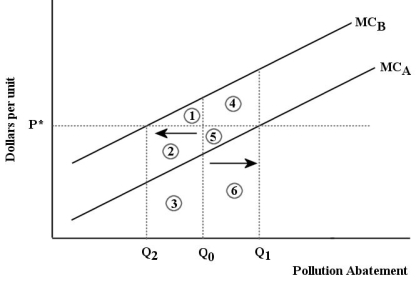 FIGURE 17-7
-Refer to Figure 17-7.Suppose that a system of tradable pollution permits is introduced into this market and the equilibrium permit price is p*.Firm B will buy permits from Firm A because
A) its total cost of abating less (areas 1 + 2 + 3) exceeds the cost of buying the permits (areas 2 + 3) .
B) its total savings from abating less (areas 1 + 2 + 3) exceed the cost of buying the permits (areas 2 + 3) .
C) Firm B has lower costs of pollution abatement than Firm A.
D) its total savings from abating less (areas 1 + 2 + 3) exceed the total costs of Firm A abating more (area 6) .
E) Firm B can buy the permits at a lower price than Firm A.
Correct Answer:
Verified
Q104: The diagram below shows a market for
Q105: The diagram below shows the marginal cost
Q106: As a method of pollution control,tradable emissions
Q107: The diagram below shows a market for
Q108: If emissions permits are traded freely between
Q110: The diagram below shows a market for
Q111: Economists often argue that a system of
Q112: Given that different firms typically have different
Q113: The diagram below shows a market for
Q114: Suppose a firm producing roof shingles imposes
Unlock this Answer For Free Now!
View this answer and more for free by performing one of the following actions

Scan the QR code to install the App and get 2 free unlocks

Unlock quizzes for free by uploading documents