The table below provides macroeconomic data for a hypothetical economy.Dollar amounts are all in constant-dollar terms.
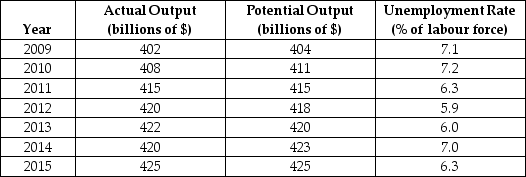 TABLE 19-1
-Refer to Table 19-1.What is the output gap in 2010?
A) $408 billion
B) $411 billion
C) $7.1 billion
D) $3 billion
E) -$3 billion
Correct Answer:
Verified
Q9: In macroeconomics,the "output gap" is the difference
Q12: In macroeconomics,what is the output gap?
A)the measure
Q27: The table below provides macroeconomic data for
Q29: An output gap with Y < Y*
A)is
Q34: On a graph showing real national income
Q35: Which of the following correctly describes the
Q36: The table below provides macroeconomic data for
Q37: Which of the following correctly describes the
Q39: On a graph showing real national income
Q40: Suppose actual output is less than potential
Unlock this Answer For Free Now!
View this answer and more for free by performing one of the following actions

Scan the QR code to install the App and get 2 free unlocks

Unlock quizzes for free by uploading documents