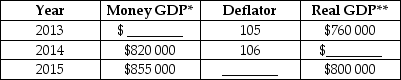
The table below shows total output for an economy over 3 years.
 * millions of dollars
** real GDP measured in millions of 2007 dollars
TABLE 20-7
-Refer to Table 20-7.The growth rate of nominal output from 2013 to 2014 is
A) 2.76%.
B) 3.36%.
C) 4.09%.
D) 4.27%.
E) 5.00%.
Correct Answer:
Verified
Q81: The table below shows total output for
Q82: Suppose that nominal national income in some
Q83: The table below shows total output for
Q84: The table below shows total output for
Q85: Real GDP is equivalent to
A)the money value
Q87: The table below shows total output for
Q88: The table below shows the total output
Q89: The table below shows total output for
Q90: The table below shows total output for
Q91: The table below shows the total output
Unlock this Answer For Free Now!
View this answer and more for free by performing one of the following actions

Scan the QR code to install the App and get 2 free unlocks

Unlock quizzes for free by uploading documents