 FIGURE 21-2
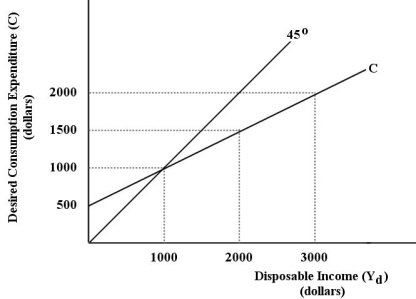
-Refer to Figure 21-2.The slope of the consumption function in the figure is equal to
A) the marginal propensity to consume.
B) the average propensity to consume.
C) the marginal propensity to save.
D) the average propensity to save.
E) the slope of the 45-degree line.
Correct Answer:
Verified
Q25: Q28: Q28: Consider a consumption function that is upward Q29: Q29: Desired consumption divided by disposable income is Q31: The table below shows disposable income and Q32: The table below shows disposable income and Q33: Consider a consumption function of the following Q34: On a graph of a consumption function,what Q35: Unlock this Answer For Free Now! View this answer and more for free by performing one of the following actions Scan the QR code to install the App and get 2 free unlocks Unlock quizzes for free by uploading documents![]()
![]()
![]()
![]()

