The table below shows national income and imports.The level of exports is fixed at $300.All figures (in table and questions) are in millions of dollars.
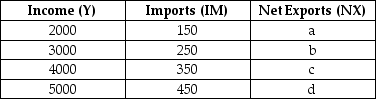 TABLE 22-1
-Refer to Table 22-1.On a graph of the net export function for this economy,at what level of Y would the NX function intersect the horizontal axis?
A) at $0
B) at $2000
C) at $3500
D) at $4000
E) at $5000
Correct Answer:
Verified
Q31: A rise in the Canadian-dollar price of
Q37: A parallel downward shift in the net
Q38: Suppose exports are $1850 and imports are
Q39: An upward shift and flattening of the
Q44: The diagrams below show the import,export,and net
Q45: The table below shows national income and
Q47: The diagrams below show the import,export,and net
Q49: Consider a consumption function in a simple
Q52: Consider an open economy that has a
Q54: Consider a consumption function in a simple
Unlock this Answer For Free Now!
View this answer and more for free by performing one of the following actions

Scan the QR code to install the App and get 2 free unlocks

Unlock quizzes for free by uploading documents