The table below shows data for five economies of similar size.Real GDP is measured in billions of dollars.Assume that potential output for each economy is $340 billion.
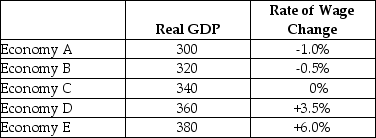 TABLE 24-1
-Refer to Table 24-1.How is the adjustment asymmetry demonstrated when comparing Economy A to Economy E?
A) The size of the output gap is the same in Economies A and E,but wages are rising in A and falling in E.
B) The output gap is larger in Economy A,yet wages are changing more slowly.
C) The output gap is much larger in Economy E,so wages are changing at a faster rate.
D) The size of the output gap is the same in Economies A and E but wages are falling more slowly in A than they are rising in E.
E) There is insufficient data with which to observe the adjustment asymmetry.
Correct Answer:
Verified
Q42: Suppose the following conditions are present in
Q45: Suppose that the economy is initially in
Q45: Consider an AD/AS model in long-run equilibrium.An
Q46: Suppose that the economy is initially in
Q46: Suppose the economy is initially in a
Q48: The table below shows data for five
Q50: An economy may not quickly and automatically
Q51: The table below shows data for five
Q52: Consider the AD/AS macro model.The wage-adjustment process
Q80: Consider an economy with a relatively steep
Unlock this Answer For Free Now!
View this answer and more for free by performing one of the following actions

Scan the QR code to install the App and get 2 free unlocks

Unlock quizzes for free by uploading documents