The diagram below shows the market for financial capital in the long run when real GDP is equal to potential output,Y*. 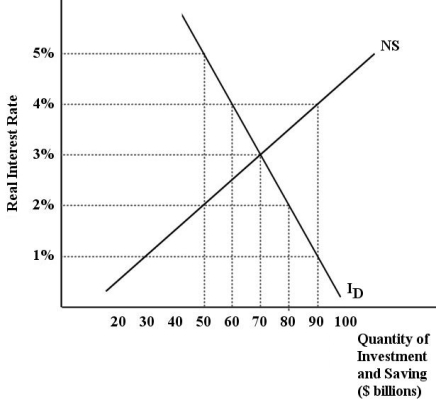 FIGURE 25-3
-Refer to Figure 25-3.Suppose the interest rate in this market for financial capital is 4%.In this case there is an excess ________ financial capital of ________ billion dollars.
A) supply of; 30
B) demand for; -60
C) supply of; 90
D) demand for; 30
E) demand for; 60
Correct Answer:
Verified
Q61: The Neoclassical growth model assumes that,with a
Q64: The Neoclassical growth model assumes that,with a
Q65: In the Neoclassical growth model,decreases in the
Q67: In the Neoclassical growth model,if capital and
Q68: The diagram below shows the market for
Q69: The diagram below shows the market for
Q73: The diagram below show the market for
Q76: The diagram below shows the market for
Q79: Data from most industrialized countries show that
Q87: In Neoclassical growth theory,an increase in the
Unlock this Answer For Free Now!
View this answer and more for free by performing one of the following actions

Scan the QR code to install the App and get 2 free unlocks

Unlock quizzes for free by uploading documents