The table below shows real GDP,potential GDP and the unemployment rate for a hypothetical economy.
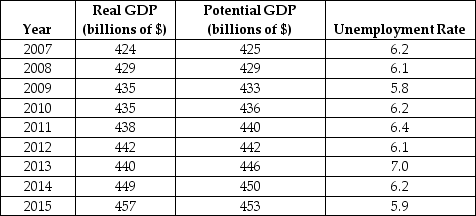 TABLE 30-3
-Refer to Table 30-3.The variations in the unemployment rate between 2007 and 2015 are likely due to variations in
A) the NAIRU.
B) frictional unemployment.
C) structural unemployment.
D) potential output.
E) the output gap.
Correct Answer:
Verified
Q105: Other things being equal,many economists believe that
Q109: Which of the following would be the
Q110: The table below shows the percentage of
Q112: The table below shows the percentage of
Q113: One motivation for having publicly subsidized retraining
Q115: The economy in the diagram below begins
Q116: The economy in the diagram below begins
Q116: Which of the following best explains why
Q118: Which of the following policies could the
Q120: The table below shows the percentage of
Unlock this Answer For Free Now!
View this answer and more for free by performing one of the following actions

Scan the QR code to install the App and get 2 free unlocks

Unlock quizzes for free by uploading documents