The diagram below shows two budget deficit functions for a hypothetical economy. 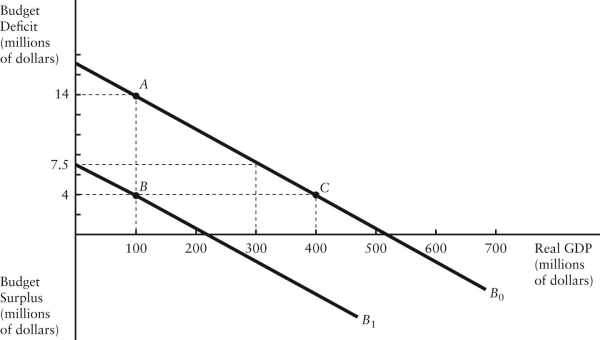 FIGURE 31-2
-Refer to Figure 31-2.Initially,suppose real GDP is $100 million and the budget deficit is $14 million,as shown by point A.Which of the following events could result in a move from point A to point C?
A) a fiscal expansion and an increase in GDP
B) a fiscal contraction and an increase in GDP
C) a fiscal expansion and a decrease in GDP
D) a fiscal contraction and a decrease in GDP
E) an increase in GDP with no change in fiscal policy
Correct Answer:
Verified
Q37: The stock of government debt will continue
Q38: The table below shows government purchases (G),net
Q39: The table below shows government purchases (G),net
Q40: The Canadian federal government's net debt as
Q42: The budget deficit function is graphed with
Q43: The diagram below shows the budget deficit
Q44: The diagram below shows the budget deficit
Q46: The diagram below shows two budget deficit
Q50: Consider the government's budget deficit function.Other things
Q57: Suppose the government's budget deficit falls from
Unlock this Answer For Free Now!
View this answer and more for free by performing one of the following actions

Scan the QR code to install the App and get 2 free unlocks

Unlock quizzes for free by uploading documents